
Who Claims the Title as Headwater State?
How does water move across the West? Which state is the West's true headwaters state?

Revisited June 2025
It's runoff season and waters flowing! With all the water rushing from headwaters to large rivers, we wondered which state generates the most water for everyone else? Which state take's the title as the true headwater state? Let's get ready to rumble.
Coloradoans are quick to brag about their "headwater" state status. You'll sometimes hear a Coloradoan say, "It all flows downhill from here." In an attempt to get a real sense of how water moves across the West, we figured we'd put a microscope to that statement. Where does the water really originate? Well, that depends on what question you ask...
How much area is upstream?
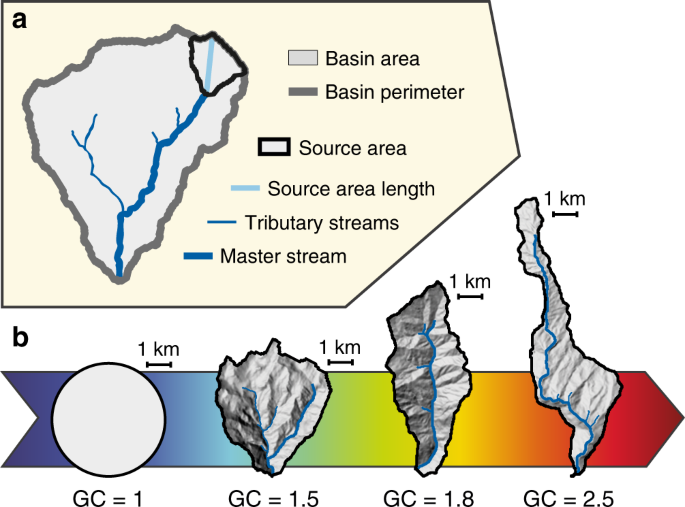
A location with a small upstream area will be the closest to the source of water (diagram-left). Alpine creeks flowing out of the glacier only have upstream area traced back to the top of the mountain, while large rivers collect water over a vast area that includes all the feeder streams and creeks that contribute to the large flow.
Though it is true that more major rivers originate out of Colorado than any other state, Colorado's rivers are (on average) further from their headwaters than Wyoming's rivers are from their headwaters which has a smaller cumulative upstream area. Here rankings are scaled by state size.
| Rank | State | Upstream Area (mi²) | State Area (mi²) | Upstream/State Ratio | Source |
|---|---|---|---|---|---|
| 1 | Wyoming | 21,08117 | 97,818 | 21.55 | hydrosheds.org |
| 2 | Colorado | 28,55611 | 104,185 | 27.41 | |
| 3 | New Mexico | 3,868,743 | 121,697 | 31.79 | |
| 4 | California | 10,757,964 | 163,696 | 65.72 | |
| 5 | Idaho | 5,633,230 | 83,642 | 67.35 | |
| 6 | Utah | 6,298,098 | 84,899 | 74.18 | |
| 7 | Montana | 11,381,133 | 147,040 | 77.40 | |
| 8 | Nevada | 19,802,793 | 110,567 | 179.10 | |
| 9 | Washington | 13,754,889 | 71,362 | 192.75 | |
| 10 | Arizona | 25,000,114 | 113,998 | 219.30 | |
| 11 | Oregon | 64,297,759 | 98,466 | 652.99 |
Which state supplies the most water?
Upstream area doesn't tell the whole story though. Theoretically, a watershed could have a small upstream area with minimal water flowing downstream. So, another factor in figuring out which state holds the title of "the headwaters state" is to consider how much water that state supplies. Scientists took to answering this question in a publication from 2016, estimating the amount of water supply produced for each state annually (measure in millions of acre-feet: MAF). Our ranking is scaled to sq. miles, that way bigger states aren't ranked higher simply because they have more area to collect water. Another blow to Colorado's self-claimed title.
| Rank | State | Water (MAF/year) | (MAF/year/mi²)/State Area | State AF/year/mi² | Source |
|---|---|---|---|---|---|
| 1 | Washington | 93.36 | 0.001308259 | 1308.26 | Brown et al 2016 |
| 2 | Oregon | 90.85 | 0.000922654 | 922.65 | |
| 3 | Idaho | 43.76 | 0.000523182 | 523.18 | |
| 4 | California | 83.93 | 0.000512719 | 512.72 | |
| 5 | Montana | 38.46 | 0.000261561 | 261.56 | |
| 6 | Wyoming | 19.42 | 0.000198532 | 198.53 | |
| 7 | Colorado | 16.95 | 0.000162691 | 162.69 | |
| 8 | Utah | 7.06 | 8.32E-05 | 83.16 | |
| 9 | Nevada | 8.35 | 7.55E-05 | 75.52 | |
| 10 | New Mexico | 3.7 | 3.04E-05 | 30.40 | |
| 11 | Arizona | 3.4 | 2.98E-05 | 29.83 |
Which state has the most streams classified as headwaters?

The Strahler stream order system is used to characterize stream size and identify streams into a hierarchy of tributaries. When two 1st order streams merge they become a 2nd order stream. In order to gain in Strahler number, merging streams must be the same value. In the diagram above, the largest stream forms when the two order 3 branches converge. In this system, 1st and 2nd order streams are defined as headwater streams. So let's rank each western state based on the proportion of stream miles that are classified as headwaters. No surprise Nevada takes this category, with lots of small collections of water, but not enough water to collect into larger rivers.
| Rank | State | Strahler 1, 2 (mi) | Strahler >2 (mi) | All Stream (mi) | Headwater/Total % | Source |
|---|---|---|---|---|---|---|
| 1 | Nevada | 103,334.15 | 20,010.93 | 123,345.08 | 83.78 | USGS NHD |
| 2 | Arizona | 106,842.04 | 22,042.33 | 128,884.38 | 82.90 | |
| 3 | Utah | 65,886.88 | 15,024.27 | 80,911.14 | 81.43 | |
| 4 | New Mexico | 82,178.64 | 19,261.38 | 101,440.02 | 81.01 | |
| 5 | Idaho | 70,509.34 | 17,001.50 | 87,510.84 | 80.57 | |
| 6 | Oregon | 77,947.41 | 18,926.25 | 96,873.66 | 80.46 | |
| 7 | Washington | 56,341.95 | 14,222.06 | 70,564.00 | 79.85 | |
| 8 | California | 130,606.78 | 33,708.16 | 164,314.94 | 79.49 | |
| 9 | Colorado | 75,171.95 | 19,427.07 | 94,599.02 | 79.46 | |
| 10 | Wyoming | 83,585.36 | 23,171.21 | 106,756.56 | 78.30 | |
| 11 | Montana | 131,599.77 | 36,847.56 | 168,447.32 | 78.13 |
How big do the rivers get?
If we flip the coin, which states have the largest Strahler stream order, and how many miles of these large streams? The bigger a river grows, the further they are their headwaters. For example, Colorado's South Platte is tiny in comparison to the Columbia River between Oregon and Washington.
| Rank | State | Max Strahler Order | Max Strahler Length (mi) | Source |
|---|---|---|---|---|
| 1 | Wyoming | 7 | 106,756.5622 | USGS NHD |
| 2 | Utah | 8 | 80,911.14312 | |
| 3 | Idaho | 8 | 87,510.83947 | |
| 4 | Colorado | 8 | 94,599.02165 | |
| 5 | New Mexico | 8 | 101,440.0156 | |
| 6 | Montana | 8 | 168,447.3246 | |
| 7 | Washington | 9 | 70,564.00115 | |
| 8 | Oregon | 9 | 96,873.66266 | |
| 9 | Nevada | 9 | 123,345.0751 | |
| 10 | Arizona | 9 | 128,884.3764 | |
| 11 | California | 9 | 164,314.9371 |
And the Winner Is...?
To determine the winner, we summed the rankings for each category. Based on our shootout criteria, the king of the headwaters states in the West: IDAHO! Rounding out the top four are Wyoming, Utah, and then Colorado with the tie breaker over New Mexico.
| Rank | State | Summed Ranks |
|---|---|---|
| 1 | Idaho | 16 |
| 2 | Wyoming | 18 |
| 3 | Utah | 19 |
| 4 | Colorado | 22 |
| 5 | New Mexico | 22 |
| 6 | Washington | 24 |
| 7 | Oregon | 27 |
| 8 | Nevada | 27 |
| 9 | California | 27 |
| 10 | Montana | 29 |
| 11 | Arizona | 33 |
Further Reading
Biology: The secrets revealed in the shape of a fish's tail.
Conservation: Learn the foundational conservation concepts.
Gear: TFO is on a roll with their Axiom 2-x.
Sources:
- Sassolas-Serrayet, T., Cattin, R. & Ferry, M. 2018. The shape of watersheds. Nature Communications. https://doi.org/10.1038/s41467-018-06210-4
- World Wildlife Fund. 2021. Upstream Area. Hydrosheds.org
- Brown et al. 2016. Mean Annual Renewable Water Supply of the Contiguous United States. USFS. https://www.fs.usda.gov/rmrs/documents-and-media/really-mean-annual-renewable-water-supply-contiguous-united-states
- Fritz and Johnson 2011. Headwater streams-what are they and what do they do? USGS. https://www.epa.gov/sites/production/files/2015-07/documents/headwater_streams_-_what_are_they_and_what_do_they_do.pdf
- USGS. 2021. National Hydrography Dataset. https://www.usgs.gov/core-science-systems/ngp/national-hydrography