
Tracking the End of Runoff with Hydrographs
when to expect clear conditions after runoff?

May 2025
As May winds down, runoff is nearing its peak, and you're probably itching for better conditions to return to your favorite freestone river. But when can you actually expect clear water conditions to return?
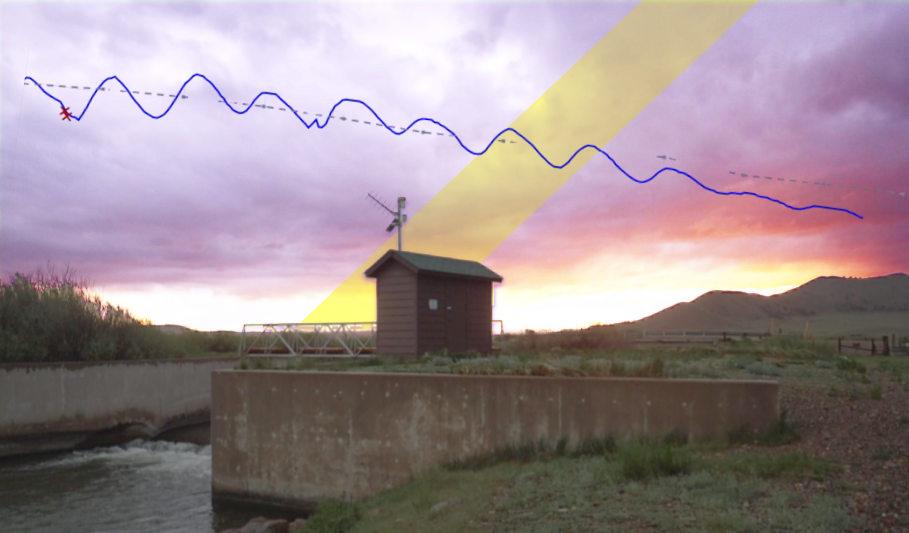
Here’s a trick for reading hydrographs: It’s not just about spotting dropping flows—more importantly, it's about watching the daily oscillations.
Understanding the Pulses
Everyone knows that during runoff, high sun and warming temperatures pulse snowmelt downstream. Yet cooler nights can't sustain the same levels of melting as during the day, and flows drop in response. This creates a daily rhythm—a diurnal oscillation— which you can observe on hydrographs in daily "melt-flush-recede" waves. You can't always count on the peaks and troughs to align perfectly with sunrise and sunset either. Transit time downstream from high mountain slopes to gauging stations, may lead to these pulses getting recorded at unusual hours.
Still, this daily “melt-flush-recede” cycle is key. When it begins to weaken, you’ll know runoff is past peak.
What to Look for on a Hydrograph
Once runoff approaches its peak, the amplitude of those daily pulses starts to fade. Why? In early May, newly exposed snow melts rapidly, it's fallen all over the mountain, in places highly exposed to direct sun ray. So water races downhill and increasing flows churning up sediment. This leads to classic runoff conditions: big water and poor clarity.
But by late June—or even July—most of the exposed easy to melt snowpack has already shifted phases. What's left is the hard to warm snow tucked behind shadows. Only isolated patches of perennial snow remain, and even with strong sun, the volume of available meltwater decreases. Water churning downstream now relates to ambient flows, collecting flows from groundwater, or other dispersed melting sources: As a result, the hydrograph begins to stabilize. That smooths out the dramatic sine wave of earlier weeks into a more stable, downward trend.
This is your sign: when you notice daily oscillations shrinking and flows stabilizing, clearer conditions are on the way.
Visual Clues from the River
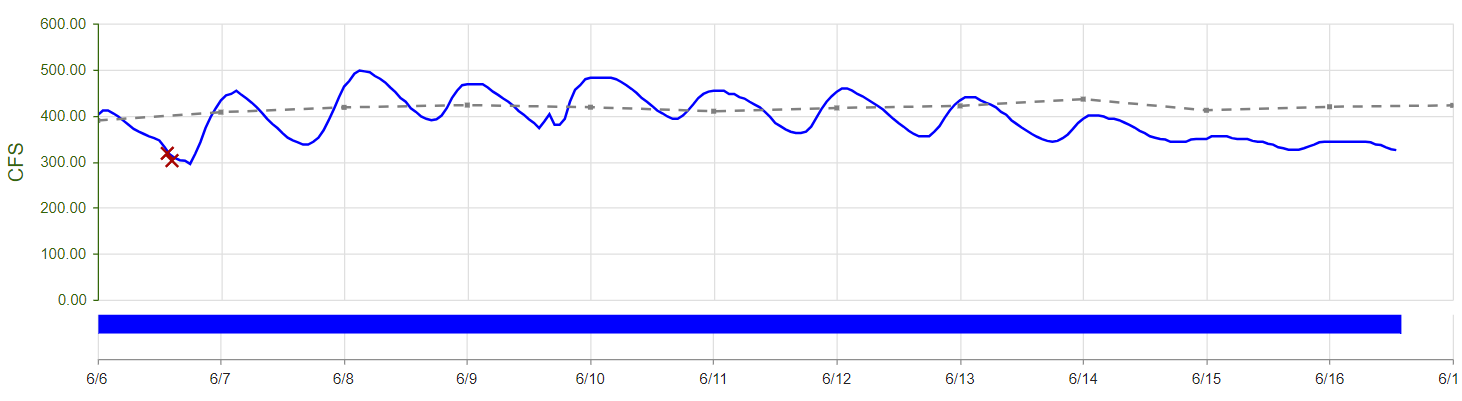
- Example: Rising Flows (Clear Creek, CO): Daily fluctuations increase as snowmelt intensifies
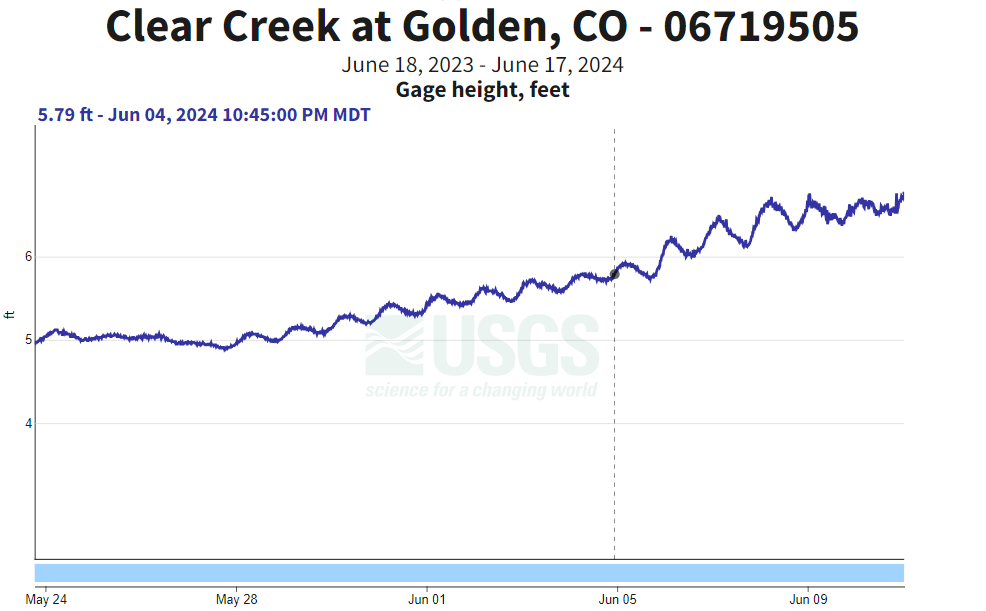
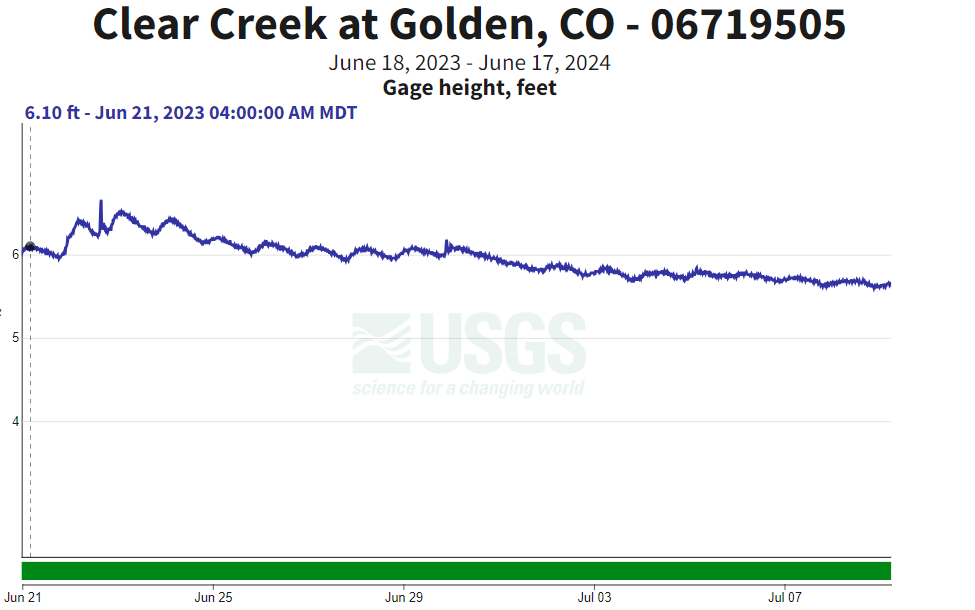
- Example: Dropping Flows (Clear Creek, CO): Oscillations shrink, and gauge height decreases—clarity is improving

More on Runoff
Always remember that local weather and upstream snowpack vary, so watch your nearest USGS gauges regularly.
If you can't wait, or want to brave high dirty flows, fishing during runoff can be surprisingly productive.